
Disclosure: HopMatrix is built by my employer. Nobody asked me to write this.
The Genesis of a Tool
We’ve all been there. You’re working on something at 2am during a network cutover or outage and you wish you had a tool that did x. Unfortunately you’re on a customer jump box and don’t have your usual toolset. Most of the times you can’t install anything either. Then even if you can install things, the tools you have may not be the tools you need.
One night Brian Adams had the same experience, but being a newly christened Claude Code fanatic he decided to do something about it. The original problem was that he needed a visual traceroute tool with continuous tracing similar to WinMTR. But beyond that the tool needed to be able to continuously monitor multiple paths concurrently to account for ECMP. He was tired of running multiple tracert commands and other tools that didn’t quite meet his needs. But rest assured, this is not AI slop. Brian built multiple testing structures and made sure that the result was properly signed and reviewed.
The result was HopMatrix. At it’s core, the tool is a visual hop by hop network tool that monitors packet loss, path MTU and shows the path or paths that packets are traversing.
Let’s Trace Something
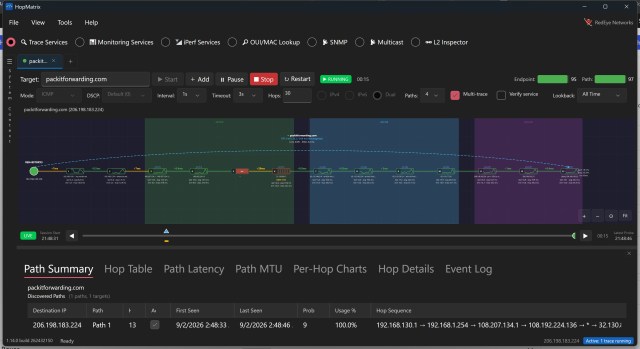
In this example, I did a trace from my home to the colocation server where my blog lives. This is a fairly simple singular path, but it shows some of the power of HopMatrix. The colored boxes in the trace highlight the different Autonomous Systems (AS) that the packet traverses. This can be very useful when finger pointing starts and one ISP is blaming the other.
You will also note that each hop has it’s own graph. These graphs are all continuous showing latency to the hop along with packet loss. Speaking of time, after the tool has run for a bit you can drag the slider across the bottom and look at the data at a certain point in time instead of the live data.
We have used this to great affect with customers when there are intermittent issues. Running HopMatrix on one or more endpoints can give us the data to prove to an ISP where an issue lies. For example in one case we found that when the customer’s employees reported issues always coincided with the traffic taking a different path than normal. When the applications were running well it was traversing one AS between Europe and North America, but when it was slow it was using a different transit AS. Showing this to the ISP got the problem resolved fairly quickly.
MTU, it’s always MTU
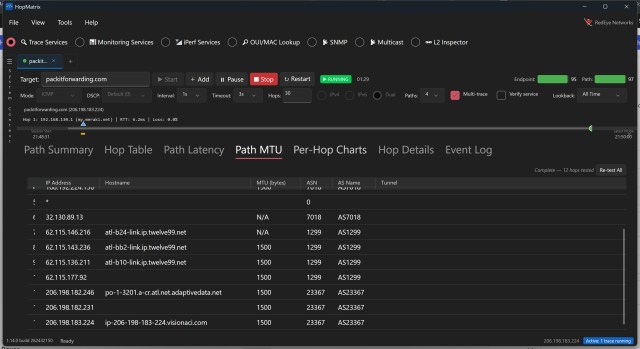
You would think in this day and age we would be past MTU issues, but just like in the days of PPP over Ethernet DSL connections, MTU matters. IPSec especially brings up issues with MTU and fragmentation. Path MTU Discovery was supposed to solve this, but many hops on the internet drop the packets needed for this to work end to end. HopMatrix will probe the path and provide a hop by hop MTU.
Again we were able to use this in the real world. In the middle of a SD-WAN implementation for a customer we started noticing some weird issues with 802.1x authentication. Sometimes it would work over SD-WAN, sometimes it wouldn’t. Prior to the SD-WAN implementation these sites were on private links without encryption. SD-WAN brought in an overlay of IPSec tunnels. After some digging and packet captures we figured out that the EAP-TLS packets were getting mangled because they were larger than the MTU along the path. HopMatrix was able to show us what the minimum MTU was across the path and we were able to put in appropriate mitigations on both ends to ensure smooth operation.
But Wait, There’s More!
In future articles I will dive into some of the other features including host monitoring, integrated iPerf3 server and client, SNMP tools, and packet decoders for multicast and discovery protocols. Until then, I encourage you to go to give it a whirl. HopMatrix is free as in beer. Windows users can install it running the command “winget install RedEyeNetworks.HopMatrix” or by downloading the installer or portable versions. Linux and MacOS (pending notarization by Apple) binaries are also available to download. No matter what, the product is free with no “premium” features gated behind licensing. More information about the tool and the downloads can be found at https://hopmatrix.com.
As the series continues I will link to the articles below.
- Host Monitoring
- iPerf3
- SNMP Tools
- Packet Decoders
Disclaimer: HopMatrix is developed and released by my employer RedEye Network Solutions. The opinions in this blog however are my own and are not being paid for by the company or the developer. I truly believe in this tool and want more engineers to have it.



1 thought on “Now Introducing… HopMatrix!.”