
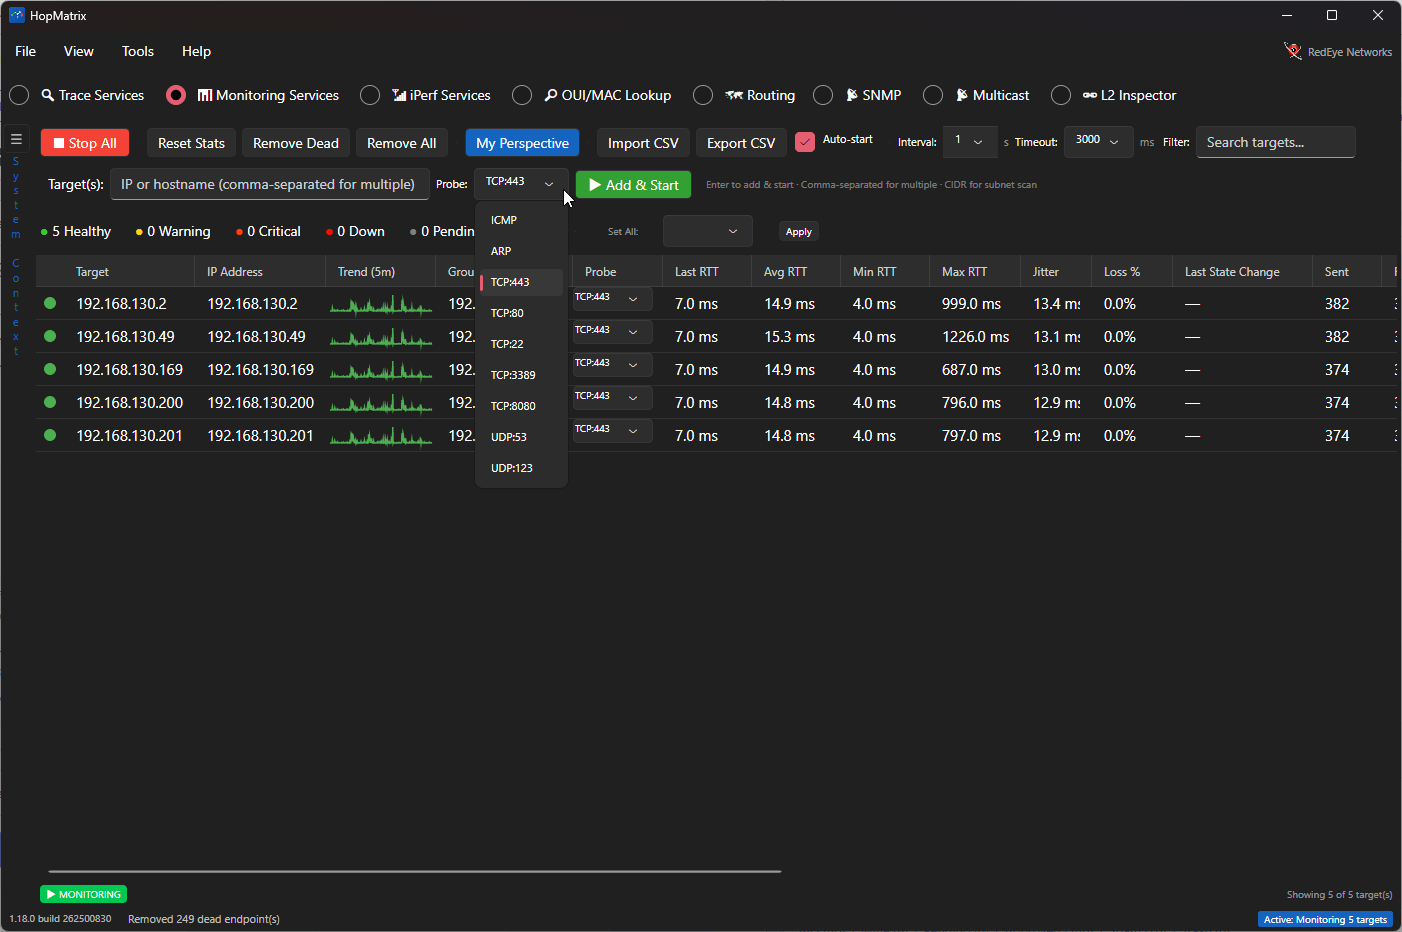
Hopefully, by now you’ve had a chance to download HopMatrix and kick the tires a bit. In this article, I’m going to focus on using HopMatrix to monitor a host or hosts. There are plenty of times, such as upgrades, outages, and migrations, where you have a set list of hosts that you need to verify are up both before and after the change. Sure, you can make a script to ping everything, but wouldn’t it be nice to have something pinging everything in parallel with latency and availability metrics?
Load Them All
One of the neat features of HopMatrix’s Monitoring Services is that you can enter multiple targets very easily. You can import them from a CSV, type them in a comma-separated list, or even tell it to add an entire subnet using CIDR notation (up to a /22).

Perhaps you want to see what is live prior to a change and then be able to verify the same hosts are back up post-change. HopMatrix has another trick up its sleeve. In the monitoring area there is a button labeled “Remove Dead”. Pressing that button will remove all of the monitored IPs that are not responding, leaving you with a clean list of hosts. Be aware that you need to wait until the initial scan finishes, or you may delete hosts that are actually live.

Is It Just ICMP?
No, definitely not. ARP is another useful thing to monitor. The ARP probe in HopMatrix’s monitoring services makes this easy to do. Imagine setting up HopMatrix on a PC and letting it run against a subnet for a day. After the day is over, you can see which IPs were in use at any time during the day to help identify truly unused IPs. HopMatrix can also monitor hosts using a layer 4. A port check proves the service is listening, not just that the stack replies. This can monitor several ports, including TCP 443, 80, and 3389, as well as UDP 53, to name a few.
Another subtle but very useful feature is that any of the lines in the monitoring sessions view can be sent to other parts of the tool via the right-click context menu. This allows you to start a full trace or run a NMAP against any host you are monitoring. Double-clicking a line is also a quick shortcut to creating a trace session.

Command Line
To help with automating some of the monitoring options, there are some CLI options you can run HopMatrix with. The switch –monitor (or -m) allows you to add targets and open directly into the Monitoring Services view. If you have a CSV file of targets, you can also use –import to add the entire file as monitoring targets.
More To Come!
There is more to come, but I encourage you to download HopMatrix today and try it out. Remember, it’s free and no signup is needed. In the next post, I’ll be exploring iPerf and how it’s built into HopMatrix.In the meantime if you didn’t see the first article on HopMatrix you can go read it now.



2 thoughts on “HopMatrix – Is It Up?”